Polar Warming Spawns More Severe Winter Storms
So there’s a lot of groundbreaking work going on in the climate sciences right now. And a major focus is evidence that winter polar warming events are increasingly connected to blizzards and storms in places like Europe and North America. Storms that are both historically powerful and that occur with greater frequency.
(A historic nor’easter produces major flooding on the U.S. East Coast even as a blizzard pounds the UK in early March. Were these extreme storms linked to human-caused climate change and related rapid polar warming? A new scientific study says — yes. Image source: NASA Worldview.)
A new study led by pioneers in the emerging field of climate change attribution for extreme weather events (including the notable Dr. Jennifer Francis), finds:
Recent boreal winters have exhibited a large-scale seesaw temperature pattern characterized by an unusually warm Arctic and cold continents… Using a recently developed index of severe winter weather, we show that the occurrence of severe winter weather in the United States is significantly related to anomalies in pan-Arctic geopotential heights and temperatures.
In particular, the authors discovered that “winter storms were two to four times more likely when the Arctic is abnormally warm, compared to when it was abnormally cold (emphasis added).”
Stronger, More Frequent Storms
This is a rather big deal for a number of reasons. First, it’s an observational confirmation of earlier scientific work predicting just these kinds of extreme weather instances due to polar warming and related climate change. Second, it’s another indicator that human-caused climate change is pushing us into a period of much stormier weather for the North Atlantic region during fall and winter.
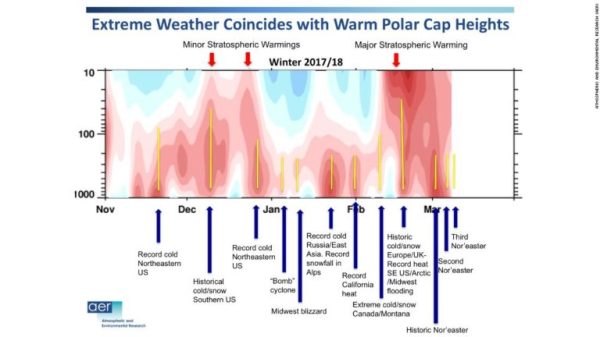
(A new study in the journal Nature finds that winter storms in the U.S. are two to four times more likely when the Arctic is abnormally warm than when it is abnormally cold. Due to human-caused climate change, the Arctic is now warming up at a rate two times faster than the rest of the globe (emphasis added). Image source: Atmospheric and Environmental Research.)
With the new NASA global temperature data set out, I thought we’d take this opportunity to apply a bit of context to apparent stormy changes we see at present in winter weather patterns.
The first bit that I’d like to be crystal clear about is that the Arctic, overall, has become much, much warmer than usual during winter. That this warming spike occurs in the context overall global warming. And that this polar warming is increasingly associated with severe weather events in the middle latitudes and especially over the land and North Atlantic mid latitude zones.
The above graph shows polar temperature anomalies from the surface (1000 mb/2 meter) of the Earth to the top regions of the atmosphere (10 mb/25 kilometers). Along the bottom of the graph, we have a list of extreme weather events. Analyzing the graph we find that major polar warming associated with extreme temperature increases at the bottom of the atmosphere all the way through to the stratosphere correlate with recently more frequent historic blizzards and nor’easters in the regions mentioned.
Polar Warming Flushing Cooler Air into the Middle Latitudes
In previous posts, I used the ground-breaking scientific research of Dr. Jennifer Francis and others as a basis to analyze how energy transfer into the polar zone in the form of heat build-up has generated these extraordinary temperature extremes. How this ramping heat is associated with polar amplification — an aspect of human-caused climate change. And how these warming events can have upstream (Jet Stream) impacts that increase storminess in the middle latitudes.
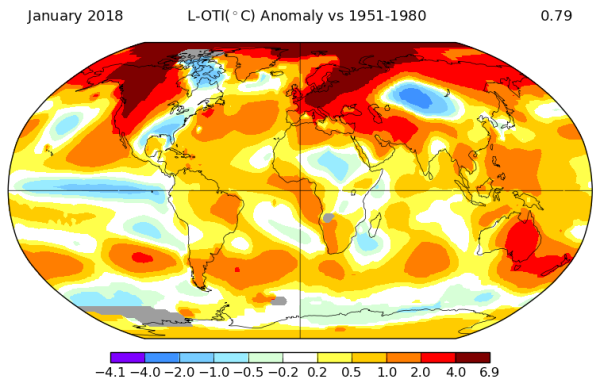
(From January [top] to February [bottom] the pole heats up and extreme weather events ensue. Image source: NASA.)
But let’s take this analysis a step further to look at, as January progressed into February, where it got warmer, where it got colder, and where the big storms fired off.
The maps above show global temperature anomalies (NASA) for January (top) and February (bottom). And looking at those maps we find that the polar region heated up significantly from already warm ranges of 4 to 6.9 degrees Celsius above average during January to an amazing 4 to 12.3 C above average during February.
As this relative polar warming increased during February, the NASA maps show that colder than normal temperatures expanded over North America through Canada and parts of the Northern U.S. even as a cold spell began to blossom in Europe. Cold pools that were fed by Arctic air shunting southward as the Polar Vortex collapsed and remnant continental troughs emerged.
NASA’s zonal anomaly measures provide further evidence for this trend.
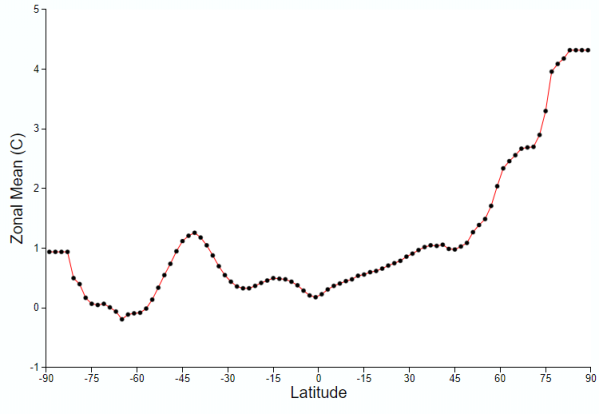
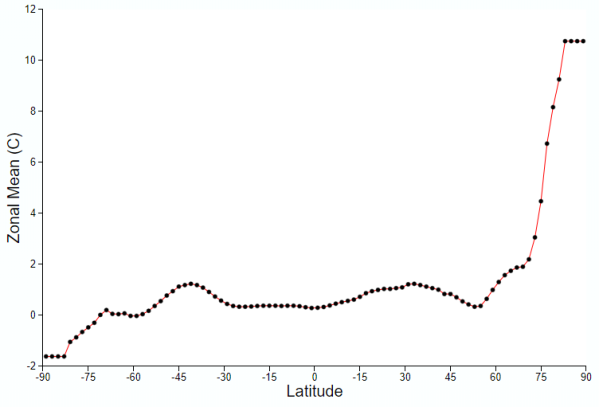
(Major northern polar warming from January [top] to February [bottom] is clearly visible in NASA’s zonal anomalies maps. Note that despite cold air excursions into North America and Europe, most zonal regions are warmer to much warmer than average.)
For here we find that as temperatures spiked from 4.5 degrees Celsius above average in the polar region of 80 to 90 degrees north latitude during January to an amazing 11 degrees above average during February, the region of 45 to 70 N dipped from 1 to 3 C warmer than average to 0.8 to 2.5 C warmer than average.
Note that the zonal middle latitude continental cooling is moderated by both the relatively warmer oceans and by very strong ridge zones running through these regions. But that the trough regions over both Europe and North America produced locally frigid temperatures and related instances of extreme weather.
Putting all these maps together from top to bottom we find that the polar warming events coincided both with mid latitude cooling even as we saw extreme snowfall in Canada and Montana, historic cold and snowfall in Europe and the UK, record flooding in the Central U.S., and record heat along the U.S. East Coast. We also find that the developing deep trough over Canada due to the expulsion of polar air southward in turn produced the succession of instabilities that would later spawn 3 very severe nor’easters off the U.S. East Coast during March.
Of course, all of these severe weather events are happening in the context of months that are around 1 degree Celsius warmer than 1880s averages globally. That January was the fifth hottest on record and that February was the sixth hottest on record during a La Nina that, all things being equal, should cause the world to be cooler than average.
But as we can see clearly here, all things are not equal — human-caused climate change is a big spoiler.


Geen opmerkingen:
Een reactie posten