Lemmings In Full Stampede Toward The Fiscal Cliff

The lemmings are now in full stampede toward the cliffs. You can literally hear the cold waters churning, foaming and crashing on the boulders far below.
From Bitcoin to Amazon, the financials, the Russell 2000 and most everything else in between, the casinos are digesting no information except the price action and are relentlessly rising on nothing more than pure momentum. The mania has gone full retard.
Certainly earnings have nothing to do with it. As of this morning, the Russell 2000, for instance, was trading at 112X reported LTM earnings.
Likewise, Q3 reporting is all over except for the shouting and reported LTM earnings for the S&P 500 came in $107 per share. That’s of signal importance because fully 36 months ago, S&P earnings for the September 2014 LTM period posted at $106 per share.
That’s right. Three years and $1 of gain. They talking heads blather about “strong earnings” only because they think we were born yesterday.
What happened in-between, of course, was the proverbial pig passing through the python.
 Trumped! A Nation on t...David A. StockmanBest Price: $13.99Buy New $44.99(as of 05:20 EST - Details)
First, the global oil, commodities and industrial deflation after July 2014 took earnings to a low of $86.44 per share in the March 2016 LTM period.
After that came the opposite—the massive 2016-2017 Xi Coronation Stimulus in China. The new Red Emperor and his minions pumped out an incredible $6 trillion wave of new credit, thereby artificially stimulating a global rebound and a profits recovery back to where it started three years ago.
The difference, of course, is that $106 of earnings back then were priced at an already heady (by historical standards) 18.6X, whereas $107 of earnings today are being priced at a truly lunatic 24.6X.
After all, nothing says earnings bust ahead better than an aging business cycle, a cooling Red Ponzi, an epochal shift toward central bank QT (quantitative tightening) and a massive Washington Fiscal Cliff. Yet every one of those headwinds are self-evident and have made their presence known with a loud clang in the last few days.
Self-evidently, we are now 36 months closer to the next recession in a business cycle which at 101 months is already approaching the 1990s record of 118 months and facing far greater headwinds. Foremost among these is the unprecedented but unavoidable turn of the central banks—after two decades of relentless expansion— toward interest rate normalization, QT (quantitative tightening) and trillions of debt and other securities sales (demonetization or balance sheet shrinkage).
The new Janet Yellen in tie and trousers made that perfectly clear at yesterday’s confirmation hearing:
Powell said he expected the balance sheet to shrink to about $2.5 trillion to $3 trillion over the next three to four years under a program set in motion by Yellen……On interest rates, Powell said: “I think the case for raising interest rates at our next meeting is coming together.”
Actually, the promised balance sheet shrinkage process is going to rapidly escalate from $10 billion per month of Fed bond sales now, to $30 billion by spring and $50 billion by next October. That amounts to a $600 billion annual run rate; and when the ECB and other banks join the “normalization” party in 2019 and beyond total central bank bond sales will pierce through the $1 trillion per year level.
And that’s a very big deal because the law of supply and demand has not yet been abolished, meaning prices and yields in the global bond market are heading for a big reset. For instance, if the UST 10-year benchmark note normalizes to a yield of 4.0%, its price will fall by more than 40% from current levels (2.35%).
Needless to say, the entire market for risk assets including equities, junk bonds, corporates and real estate is predicated upon current ultra-low yields and historically unprecedented leverage. So smash the price of the benchmark bond by 40% and you have a cascading chain of downward valuation adjustments that will reach the tens of trillions.
But that’s not all. The 19th Party Congress is over, but the Red Suzerains of Beijing wasted no time throttling down China’s red-hot credit bubble and hyperventilating housing market. The chart below is the smoking gun—-and puts the lie to the foolish Wall Street meme of the moment that the world economy is in the midst of an outburst of “synchronized growth”.
Actually, it’s puffing on the exhaust fumes of a veritable housing hysteria during the run-up to China’s 19th Party Congress, which saw home mortgage issuance soar by nearly 60% in 2016.
Now, however, Beijing’s clampdown is giving Ross Perot’s famous “sucking sound to the south” an altogether new definition. In the most recent period, year over year mortgage growth actually turned negative—-meaning China’s gigantic apartment construction and building materials complex will be cooling rapidly, too.
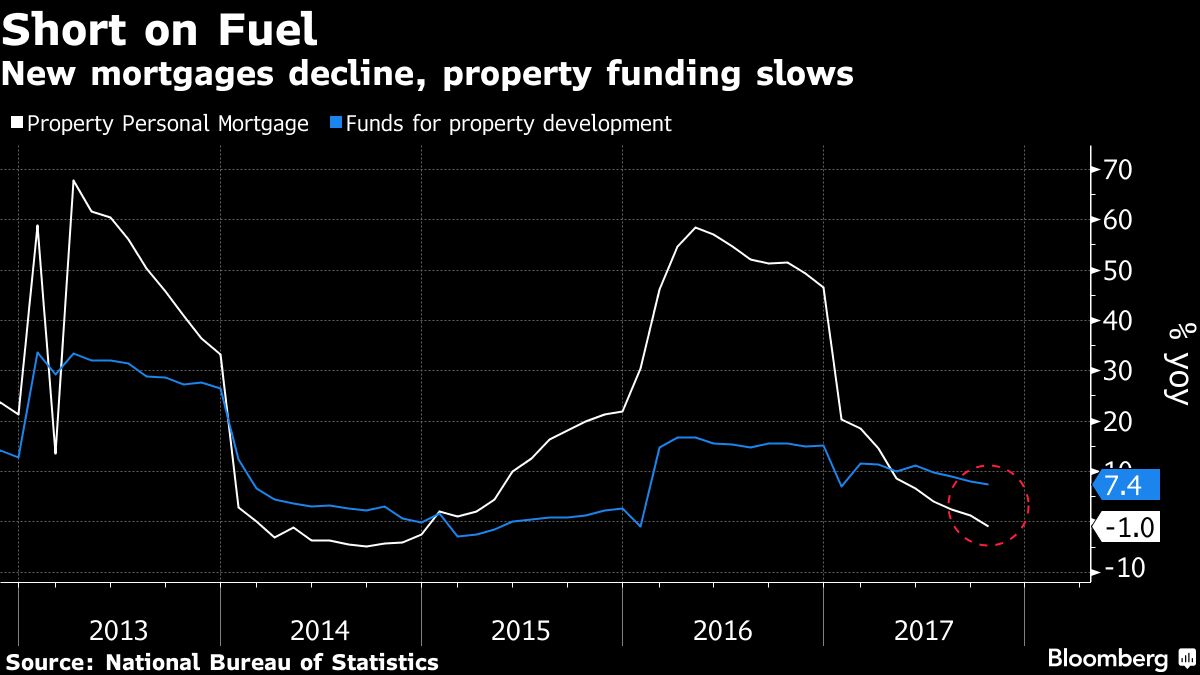
Needless to say, what happens in the Red Ponzi does not stay in the Red Ponzi. The modestly rebounding global figures for industrial production, trade and GDP reported recently were just feeding off the massive credit impulse evident in the red line below.
When S&P earnings were peaking back in September 2014, China’s total credit growth from all sources—including its $15 trillion shadow banking system—had slowed to a 15% annual run rate, but then was gunned to upwards of 30% during the Coronation Boom from early 2016 onwards.
 The Great Deformation:...David A. StockmanBest Price: $4.26Buy New $15.56(as of 04:40 EST - Details)
But now that Mr. Xi’s very thoughts have been enshrined in the Communist Party constitution—check-by-jowl with the wisdom of the Great Helmsman, Mao Zedong—-credit growth is plummeting. Even China’s new Red Emperor recognizes that $40 trillion of debt on a purported $12 trillion economy (actually far lower when massive malinvestments are deleted from the reported GDP “flows”) is a recipe for collapse.
Xi Jinping may well be delusional about the capacity of centralized bureaucrats–even ones with all the guns— to tame and stabilize the greatest Ponzi-style digging, constructing, borrowing, spending and speculating scheme in recorded history. But his goal is a third term in 2022, and in the interim he means to mop down China’s fevered borrowing and building spree with alacrity.
Accordingly, the global commodity and CapEx cycle will rapidly weaken as the red line in the chart heads toward the flat-line. The talking heads will not be gumming about synchronized global growth much longer.

But what they will be talking about soon is a US Fiscal Cliff like none before. It now seems that the desperate GOP politicians of Capitol Hill have come up with so many fiscal gimmicks that they may actually cobble together 51 votes in the Senate.
But the emerging Rube Goldberg Contraption, which sunsets all of the individual tax cuts after 2025, and then piles on top a “trigger tax”, which most surely would turn the whole things into massive ($350 billion) tax increase after a 2024 “growth” test, is actually a giant debt trap.
In fact, between 2018 and 2024 the emerging Senate “compromise” would generate upwards of $1.4 trillion of new debt including interest on the added borrowing. That’s because as we explained yesterday the Senate tax bill is front-loaded with the annual revenue loss peaking at $250 billion in 2020 and diminishing steadily thereafter to just $145 billion in 2025 and a slight surplus in 2027.
Consequently, the public debt builds up rapidly in the early years—long before any added growth could possibly move the needle. We will provide more detailed calculations on this crucial point tomorrow and completely debunk the “growth will pay for it” story.
But suffice it to say here that the massive front-loaded borrowing embedded in the Senate tax bill would come on top of the $6.1 trillion already built into the CBO baseline for the 2018-2024 period and another $1 trillion that will be needed for disaster relief and the Donald’s massive defense build-up and dramatically heightened pace of global military operations.
In a word, we do not think you can finance $8.5 trillion of new Federal debt in an environment in which the Fed and its convoy of fellow traveling central banks are also selling bonds by the trillions. That is, without triggering a “crowding out” effect of the kind that has been in hibernation every since Greenspan’s cranked up the Eccles Building printing presses after the 22% stock market plunge in October 1987.
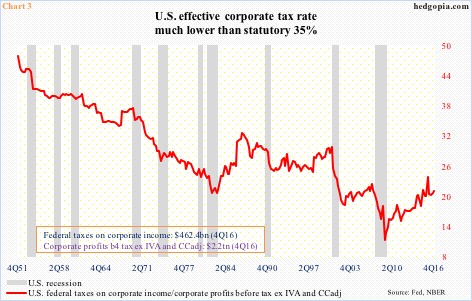
The irony is that the GOP is setting up a fiscal cliff which will exceed $1 trillion per year of new borrowing as early as 2020 ($775 billion baseline plus $225 billion of revenue losses and added interest from the tax cut) based on the erroneous view that domestic economic growth is being stunted by high corporate taxes.
This chart below should put the lie to that confusion once and for all. Even as the effective corporate tax rate has been marching down hill for decades, the trend rate of economic growth has been steadily falling.
Notwithstanding today’s GDP blip, real final sales have grown at just 1.2% per year over the last decade or by only one-third of the rate extant when the effective corporate tax rate was more than double the current 20% level.
So today’s lemming actually are marching toward a Fiscal Cliff—- oblivious to the true meaning of the Senate tax bill maneuvers. But by definition, at the blow-off peak of a great financial bubble markets are oblivious to everything except the price action.
In that context, Bitcoin is neither an outlier nor a one-off freak; it’s a poster boy for an unhinged financial system where honest price discovery, two-way markets, fear of risk and financial discipline have been completely destroyed by the central banks.
Whatever its eventual merits as a private money and payment system away from the grasping hand of the Deep State, bitcoin (and the mushrooming slate of other cryptos) at the moment is in the throes of the kind of mania that reminds us of why runaway bubbles eventually generate their own demise.
For want of doubt, Zero Hedge early today calculated out bitcoin’s accelerating rate of rise.
Needless to say, the sequence below is not the birthing throes of a new money being born; it’s just another iteration of the same old lemmings stampeding toward the cliff:
- $0000 – $1000: 1789 days
- $1000- $2000: 1271 days
- $2000- $3000: 23 days
- $3000- $4000: 62 days
- $4000- $5000: 61 days
- $5000- $6000: 8 days
- $6000- $7000: 13 days
- $7000- $8000: 14 days
- $8000- $9000: 9 days
- $9000-$10000: 2 days
- $10000-$11000: 1 day
Big dip overnight was bought and as US equity markets prepare to open, Bitcoin just topped $11,000…
Reprinted with permission from David Stockman’s Contra Corner.
Former Congressman David A. Stockman was Reagan’s OMB director, which he wrote about in his best-selling book, The Triumph of Politics. His latest book is The Great Deformation: The Corruption of Capitalism in America. He’s the editor and publisher of the new David Stockman’s Contra Corner. He was an original partner in the Blackstone Group, and reads LRC the first thing every morning.
Copyright © 2017 David Stockman
Previous article by David Stockman: Debt, Taxes, Growth


Geen opmerkingen:
Een reactie posten