Free Fall — Part 1
by David Chandler
What does it take for a tall building to collapse downward through its own structure at absolute free fall?
Galileo demonstrated long ago that any object, of any mass, falling under the influence of gravity alone would accelerate downward at a characteristic rate, which we call the acceleration of gravity, or g. The experimentally determined value of this acceleration varies slightly from one place to another on the surface of the earth. The earth bulges outward slightly at the equator and is flattened at the poles, so gravity is stronger at the poles where one is a little closer to the center of the earth. Similarly, gravity is weaker at higher altitudes. Generally speaking, however, the acceleration of gravity is about 9.8 m/s^2, which means an object will gain 9.8 m/s of speed each second it falls. Starting at rest, at the end of one second it would be moving at 9.8 m/s, at the end of two seconds it would be moving at 19.6 m/s, etc. In physics we say it accelerates at 9.8 [meters/second]/second, which is abbreviated 9.8 m/s^2. (In U. S. Customary units that would be about 32.2 ft/s2^2.) In New York City the acceleration of gravity is about 9.803 m/s^2.
How could you measure the acceleration of a falling object? If you had a priori knowledge that the acceleration was uniform and the motion started from rest, you could simply time the motion, as long as you started your stopwatch at the instant it was released and stopped it after it had moved a known distance, d. Under those conditions the acceleration could be calculated from the formula d = ½ at^2, which is typically derived early in an introductory physics class.
But if you don’t know ahead of time that the acceleration will be uniform (which would certainly apply in the case of a collapsing building), you would have to track the motion over short time intervals, calculate the velocity (speed) over each interval, and measure the rate of increase of velocity over time. If the calculated velocities are plotted on a graph, the slope of the graph would give the acceleration. If the acceleration turns out to be uniform, the vvs. t graph will be linear. Otherwise the “slope of the graph,” at any point, would be the slope of the tangent line.
One way to get high quality measurements of position as a function of time is by using video taken with a stationary camera. The pixels measure position and the frame rate measures time. A tool I use in my physics teaching for tracking motions in videos, is called Tracker, a free, downloadable program, part of the Open Source Physics project. (Tracker is a common term, so search for “OSP Tracker” on the internet.) To get real-world measurements you would need to calibrate the measurement, using some feature in the video with known size, to convert pixels to, say, meters.
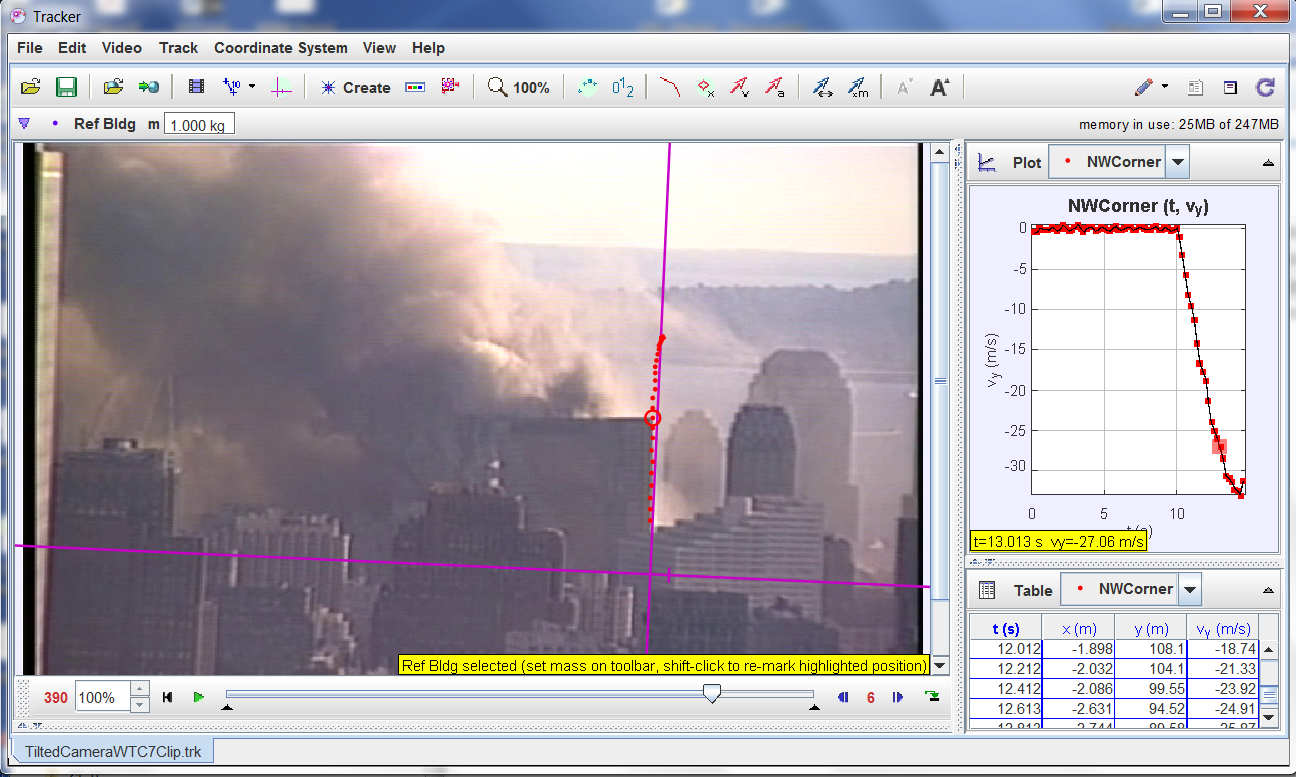
The illustration at the head of this article shows a screen shot from Tracker being used to measure the motion of the NW corner of World Trade Center Building 7 (WTC 7) as it fell at 5:20 pm on the evening of September 11, 2001. Although the collapses of the Twin Towers have been shown many times on the television, Building 7 is rarely shown, and many people don’t know that a third tall building in the World Trade Center complex, 47 stories, nearly half the height of the Twin Towers, fell that day. The video used for this measurement is particularly suitable for our purposes because (notice the tilt) the video camera was left running but unleveled and unmonitored. No one was touching the camera, so the images are especially stable. Tracking a corner of an adjacent building shows only small random jitter no more than about 20 cm, probably due to atmospheric turbulence through the telephoto lens.
The trail of dots on the image of the building shows the motion of the NW corner over time. The graph in the top right corner of the display shows the computed velocity plotted as a function of time. This graph shows the NW corner holding steady, then suddenly transitioning to downward motion. The graph is essentially linear from the start of fall continuing for the next 2.5 seconds, indicating that the acceleration is uniform.
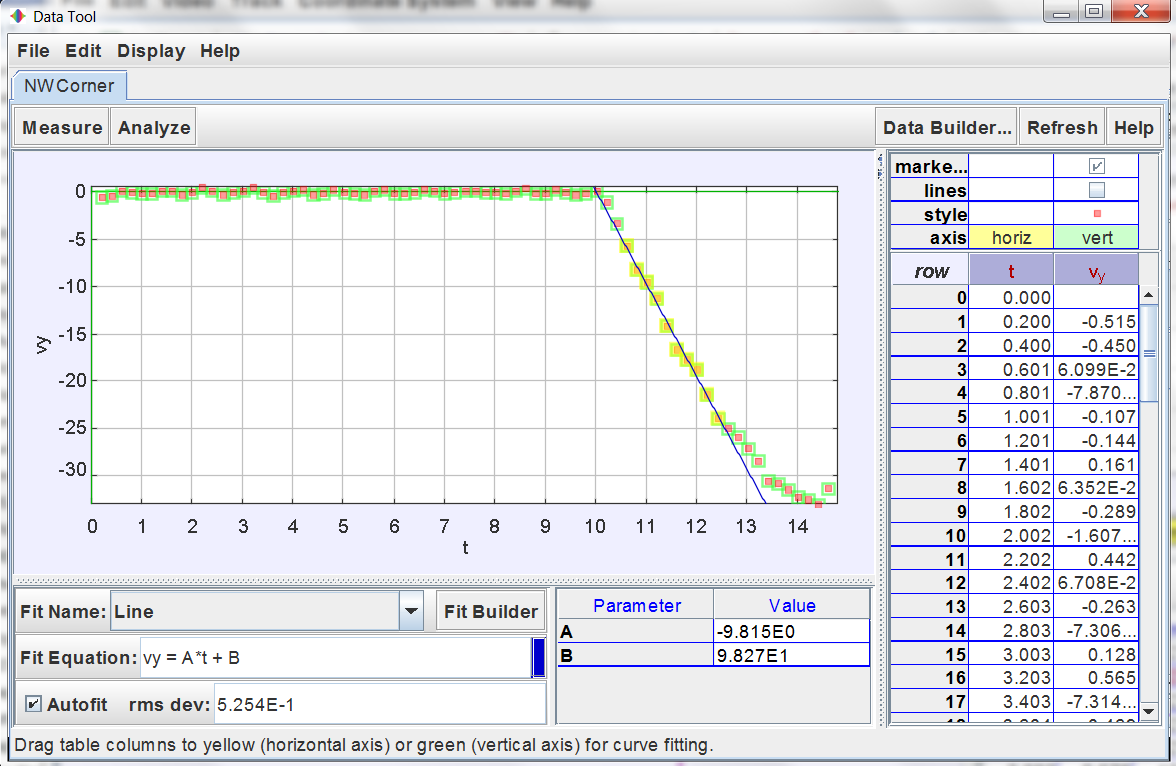
Porting the data to a companion program, called Data Tool, which is bundled with Tracker, we can select a range of data points (yellow highlights), plot a “best fit” regression line, and compute the slope. As you can see from the parameter labelled A, the slope is about 9.81, which is essentially g, within the precision of the measurements. Free fall.
A body falling with no resistance falls in free fall. Conversely, for a body to be in free fall implies it is falling with no resistance. Somehow the building we are seeing is falling through its own structure with no resistance!
After about 2.5 seconds of free fall, the slope deviates from a straight line, indicating resistance as the falling part of the building engages with the bottom section. 2.5 seconds of free fall corresponds to a distance of 30.6 m, or about 100 ft. At 12.5 ft per floor, that divides out to 8 stories of free fall.
You can download a “lab kit” containing videos, calibration data and lab instructions for measuring the rate of collapse of the North Tower (WTC 1), several views of WTC 7, and two known gravity-driven demolitions for comparison on my web site. Doing the measurement yourself helps give you a feel for the data.
Things to note:
- All four corners of the building start downward within a fraction of a second of each other. The roof line remains essentially level during the entire period of free fall. Whatever is happening to remove resistance is happening across the entire width of the building simultaneously to within a small fraction of a second. Lack of precise synchronization in the removal of support would lead to tumbling.
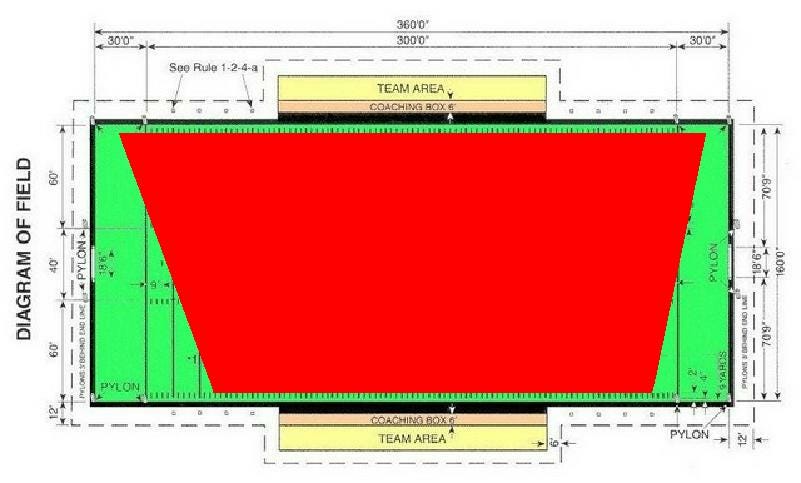
- The building is 100 m side to side, and the overall dimensions of the trapezoidal building would essentially cover a football field, overlapping into the end zones. Any coherent theory of the collapse of the building would have to account for how the process happened synchronously over such a large area.
- One penthouse, on the east side of the building, collapses early, in an event separate from the overall collapse, but the structures on the west side of the building (the right) remain supported until about a half second before the overall collapse. They remain partially visible throughout the free fall portion of the collapse. This indicates that the interior support structure is compromised first, but it gives way only a fraction of a second ahead of the perimeter walls.
I have a lot more to say about this event, but I’ll leave it for Part 2. You will no doubt recognize that I have not answered my leading question, but that will have to wait.
By the way, does this sound like conspiracy theory to you? Notice that I have not theorized, or even hypothesized anything. I am observing and analyzing public information regarding an extremely significant public event, holding it up to the light of day. This is normal curious behavior for a scientist, not political or weird or fringe. Rather, choosing not to observe or not to analyze or not to try to understand such an event for fear of where the evidence might lead, or to insist that only officially sanctioned explanations are to be permitted, or to smear with derogatory labels those who use their own eyes and powers of reason, … that is a political act, and not the kind of politics worthy of citizens of a democratic society.


Geen opmerkingen:
Een reactie posten